import matplotlib.pylab as plt
import numpy as np
import scipy.signal as signal
f1 = 10# start frequency
f2 = 12000# end frequency
fs = 96000# sampling frequency
T = 10# time duration of the sweep
fade = [48000, 480] # samlpes to fade-in and fade-out the input signal'''generation of the signal'''
L = T/np.log(f2/f1) # parametre of exp.swept-sine
t = np.arange(0,np.round(fs*T-1)/fs,1/fs) # time axis
s = np.sin(2*np.pi*f1*L*np.exp(t/L)) # generated swept-sine signal# fade-in the input signalif fade[0]>0:
s[0:fade[0]] = s[0:fade[0]] * ((-np.cos(np.arange(fade[0])/fade[0]*np.pi)+1) / 2)
# fade-out the input signalif fade[1]>0:
s[-fade[1]:] = s[-fade[1]:] * ((np.cos(np.arange(fade[1])/fade[1]*np.pi)+1) / 2)
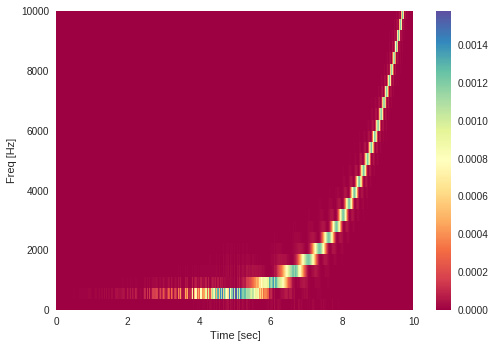
f,t,Sxx = signal.spectrogram(s, fs, nperseg=512)
plt.figure()
plt.pcolormesh(t,f,Sxx,cmap="GnBu")
plt.xlim([0,10])
plt.ylim([0,10000])
plt.xlabel("Time [sec]")
plt.ylabel("Freq [Hz]")
plt.colorbar()
plt.show()